The test installation
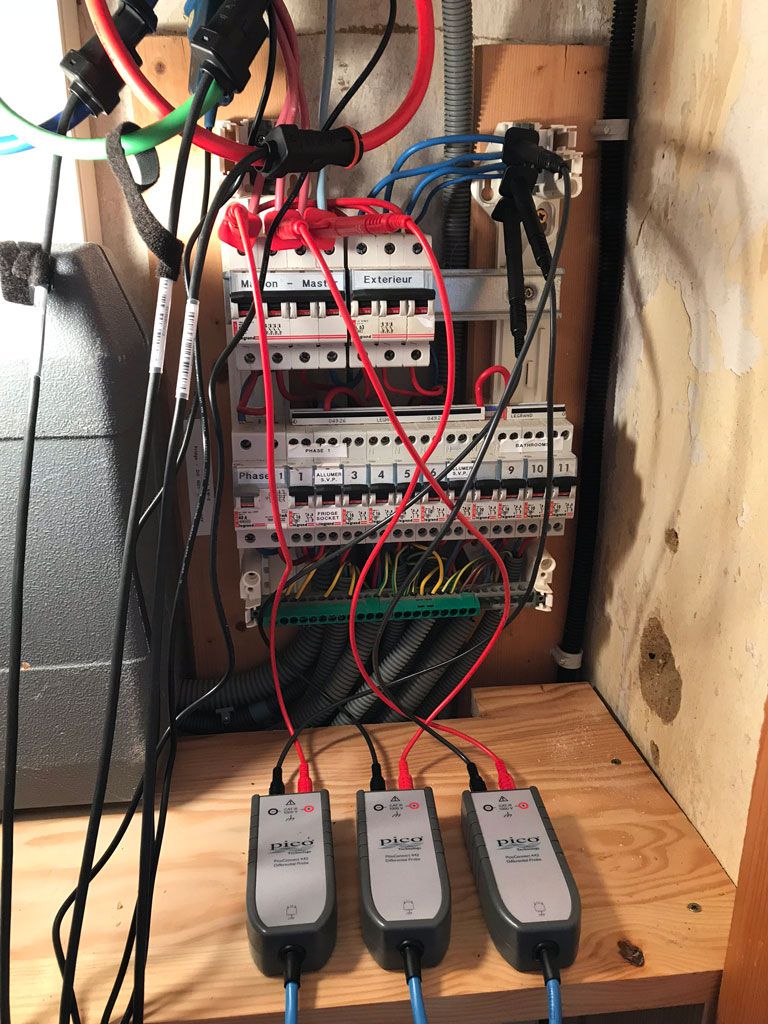
This summer, Pico’s Business Development Manager Trevor Smith selflessly volunteered to take some oscilloscopes and data loggers with him to the south of France. As he was staying in a building with a three-phase mains supply, it seemed like a perfect opportunity to test the Pico equipment and capture some waveforms.
With the main power supply switched off, Trevor hooked up a PicoScope 4444 high-resolution differential oscilloscope to the consumer unit using three PicoConnect 442 1000 V CAT III probes. These probes are rated for use in fixed mains installations on the protected side of the company fuse.
Trevor also installed a PicoScope 4824 8-channel high-resolution oscilloscope equipped with a TA325 three-phase Rogowski coil current probe. The three coils of the TA325 were wrapped around the three supply phases. These probes are highly flexible and therefore easy to install around conductors of any shape without disconnecting the supply.
Finally, Trevor added a PicoLog CM3 current-monitoring data logger with its three AC current clamps. The CM3 runs with the PicoLog software for long-term data logging.
The results
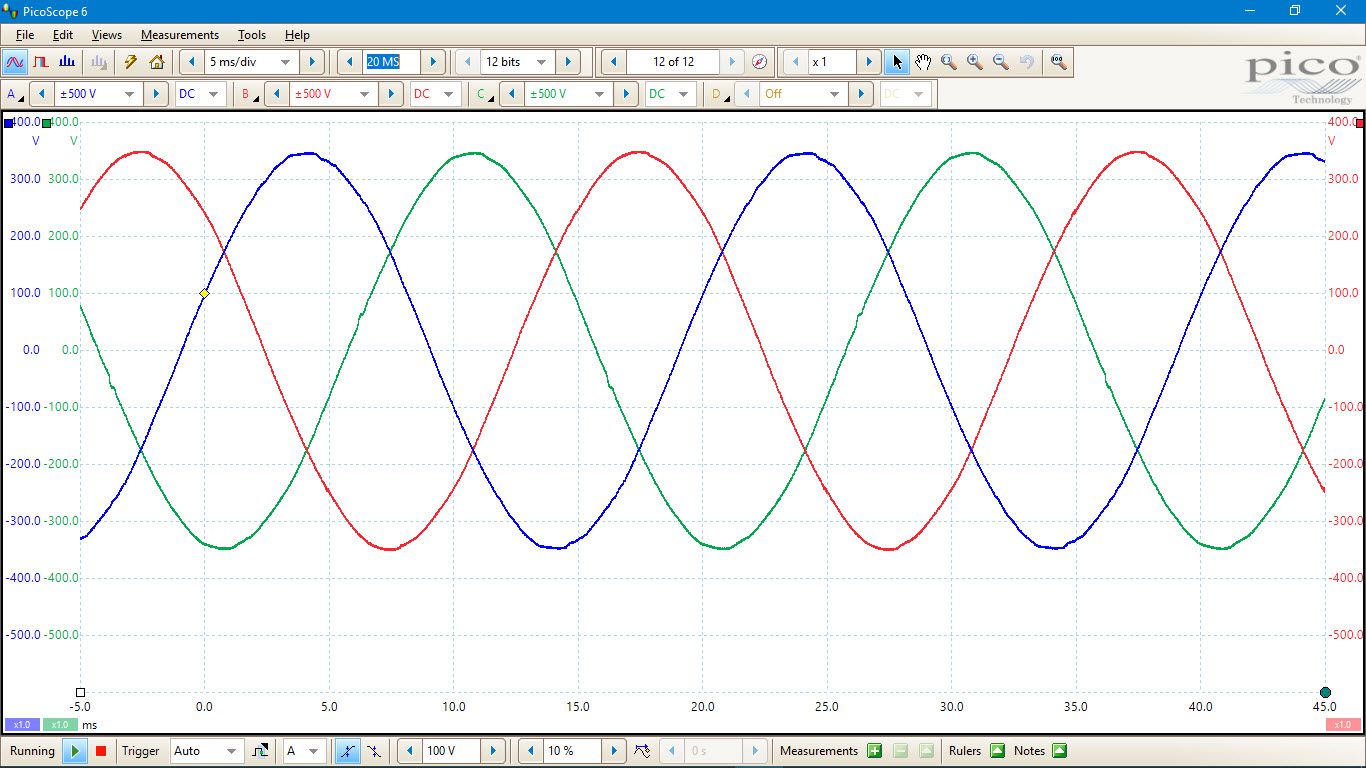
The voltage waveforms show very little distortion, indicating that the supply has a low impedance and is not being overloaded.
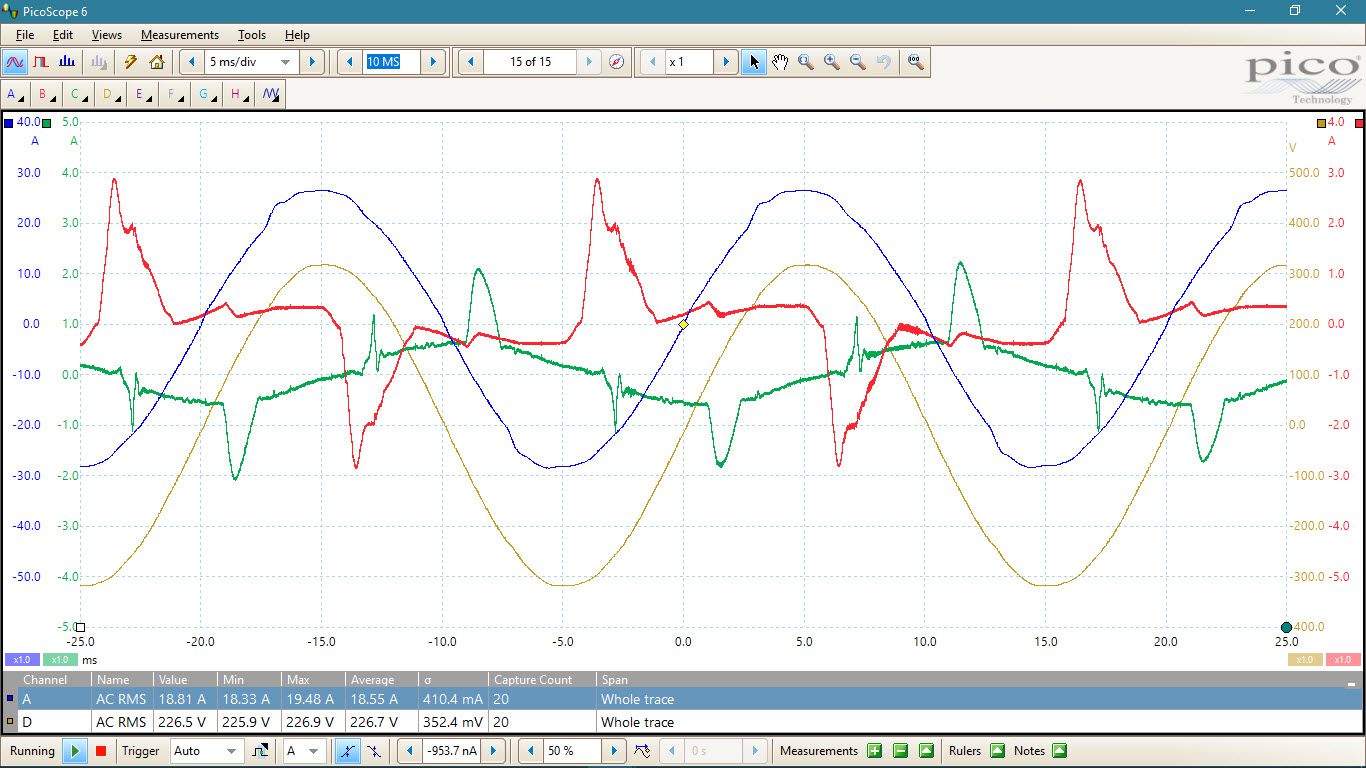
The current waveforms are obviously unbalanced. The blue phase is almost sinusoidal, indicating a large resistive load. The red and green phases are smaller in amplitude and non-sinusoidal, suggesting that the loads are switch mode power supplies.
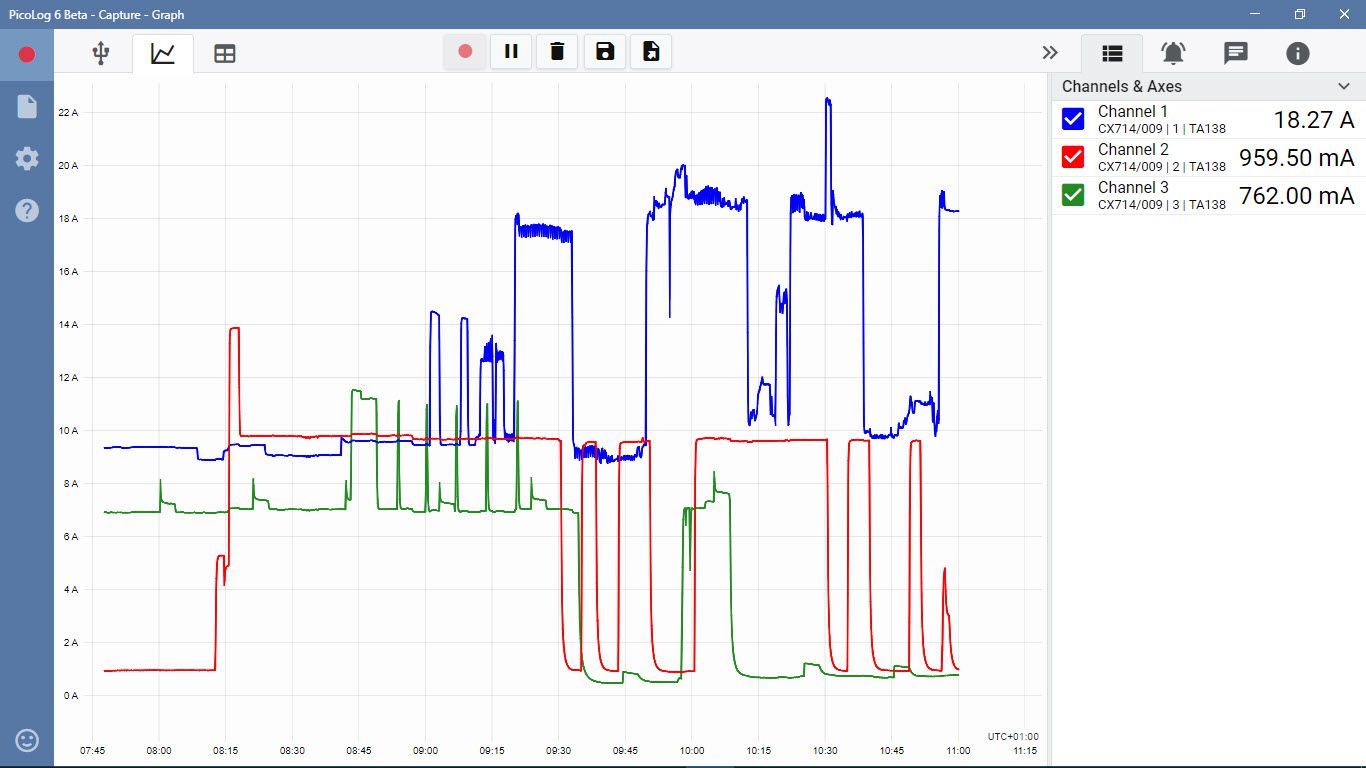
The PicoLog CM3 has plotted the three phase currents over a period of several hours. Here we are interested in the RMS current, not in the 50 hertz current waveforms. The plot shows that the blue phase is drawing a lot more current than red and green. In this case it is not a problem as the current is within the capability of the supply. In a more extreme case it might indicate a need to redistribute the loads among the three phases to prevent overloading any one phase.
Conclusion
Pico’s high-resolution oscilloscopes are ideal for capturing mains power waveforms. Both the scopes used here have 12-bit resolution, enabling them to capture highly detailed waveforms and make accurate measurements. They also have deep memory, enabling them to capture long traces at fast sampling rates. This allows you to see high-frequency detail and long-term trends, all in the same waveform.
Our 4-channel oscilloscopes are perfect for capturing three-phase voltage or current waveforms. If you need to capture both types of waveform at once, use the 8-channel PicoScope 4824.
All Pico oscilloscopes can be used with industry-standard probes and other accessories. (The PicoScope 4444 requires additional adaptors).
The PicoLog software works with all Pico data loggers including the PicoLog CM3. It is the best choice for logging over long periods of time, as it has a robust file format that can survive unexpected shutdowns and is efficient at handling very large data sets.