For full functionality of this site it is necessary to enable JavaScript.
EMINKH.COM
0

Analysis of I-V curve deviations in solar power systems

04/17/2026 14:10:16

I-V curve analysis is an in-depth diagnostic method for identifying hardware performance issues. For accurate results, devices like the Fluke Solmetric PVA-1500 compare the measured curve to a standard curve, while automatically adjusting for actual radiation and temperature conditions.

Below is the process analysis basis, derived from the scheme processing attempt by the National Renewable Energy Laboratory (NREL).

Verify measurement data

Before troubleshooting the module, you need to ensure the test is valid:

Open circuit: If no curve is obtained, check the measurement cable connection or series fuse for a broken connection.

Discontinuous connection: If the curve drops sharply or breaks abruptly, the cause is often a misaligned measurement cable or a faulty crimped terminal. The connection should be isolated and repaired before re-measuring.

Identifying 6 types of I-V curve deviations

A normal system has an efficiency coefficient of 90% - 100%. If it is lower, compare it to the following six types of deviations:

If the result is lower, compare it to the following characteristic distortion patterns:
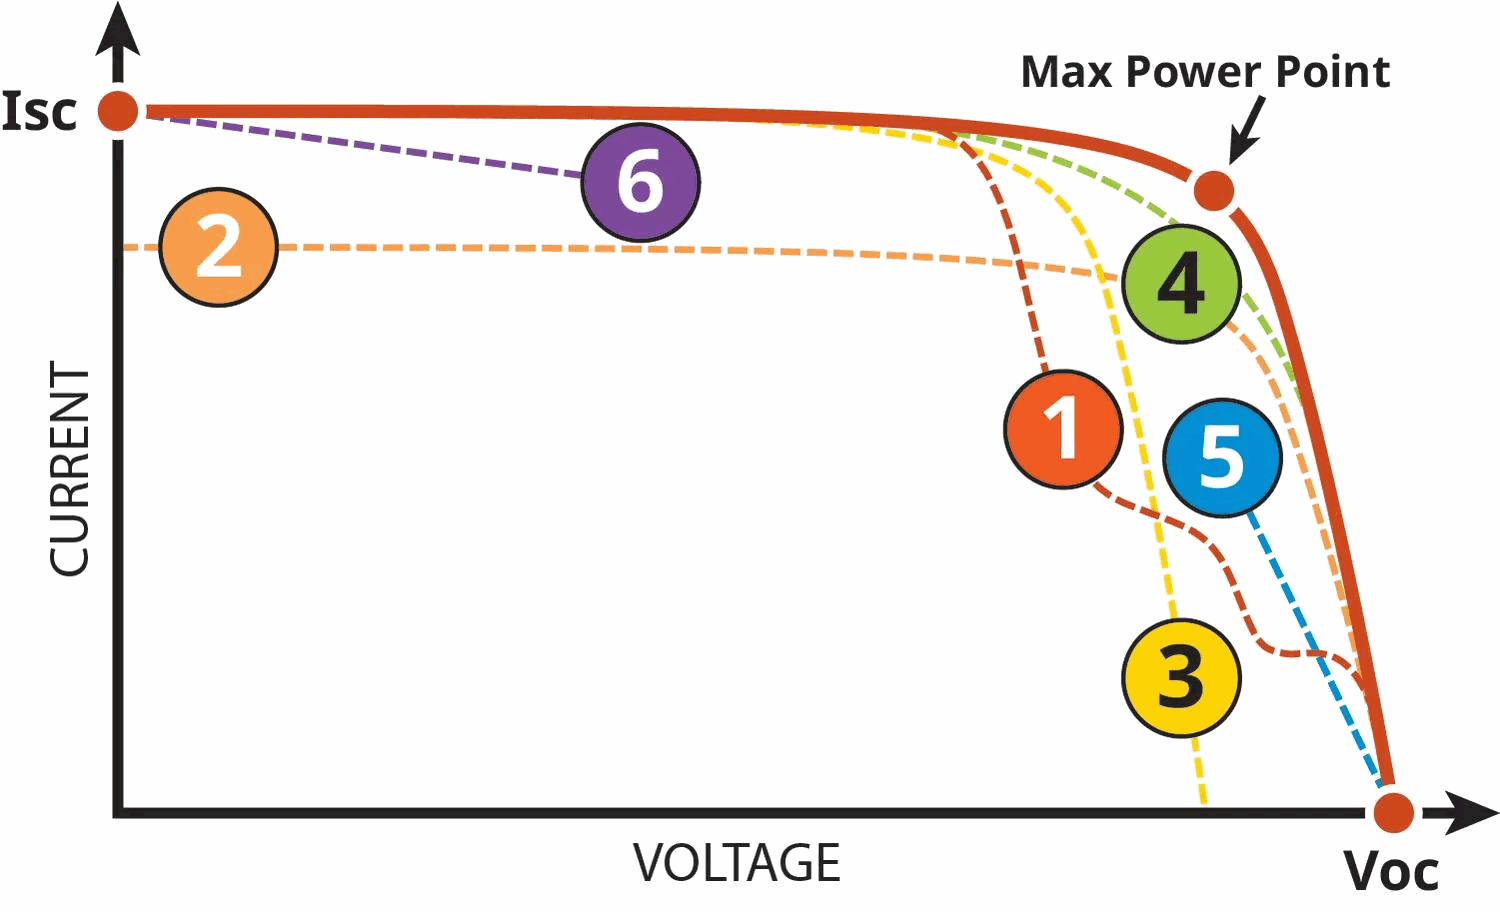
1. Staircase curve

The cracks appear due to uneven current flow between battery cells.

The bypass diode will activate to conduct current through the weak or shaded area of ​​the battery.

Common causes: localized shading, uneven dirt distribution, or faulty battery cells.

2. Low short-circuit current (Isc)

The curve shape remains normal, but the Isc value decreases.

Common causes: inaccurate radiation sensor readings, dirty or heavily covered battery surface.

3. Low open-circuit voltage (Voc)

This is often related to temperature deviations during the measurement process.

Since Vocs are less affected by aging, environmental conditions should be checked before concluding that the module is faulty.

4. The knee joint is rounded

This indicates a decline in performance over time.

The main cause is the aging or degradation of the module.

5. Low voltage ratio (Vmp / Voc)

The vertical section of the curve is steeper than normal.

Comparisons between strings can be used to detect faulty wires or connections.

6. Low current ratio (Imp / Isc)

The horizontal section has an unusually steep slope.

Shadow and dirt effects must be ruled out before inspecting the hardware.

Fluke device applications 

Fluke-PVA-1500HE2 this is the optimal device for current 1500V systems. In addition to providing detailed data, it also supports the storage and monitoring of long-term performance trends for the entire project.

Invitation to attend the Fluke Technical Workshop

To master the skills of using analyzers and directly practice analyzing various types of aberrations on real PV systems, we invite you to participate in Fluke's in-depth workshop: Predictive Maintenance for Solar Power Systems: Maximum Safety - Breakthrough Performance

Key content:

- Practical testing with the PVA-1500 Series instrument.

- Detailed instructions on the standard NREL troubleshooting flowchart.

👉 Link to participate: Here!

Representative products to support your work:

- PVA-1500 Series photoelectric analyzer.

- PVA-1500HE2 tool kit (including I-V monitor, clamp meter and multimeter).

Related News

Does thermal shock cause damage to electronic components?
07/22/2026 10:40:49

An electronic component may operate stably under constant temperature conditions yet fail after repeated rapid transitions between hot and cold. The issue typically stems not from a specific temperature level, but rather from the rate of temperature change and the number of hot-cold cycles

The rigorous standards behind a multi-million-dollar MRI suite
07/21/2026 14:54:01

An MRI system may be correctly installed and fully connected to the power supply, yet still encounter issues if the surrounding environment fails to meet technical specifications. Electromagnetic interference, RF shielding, power quality, grounding, temperature, humidity, and particulate levels are all factors that may require assessment, depending on the facility's design and the manufacturer's requirements.

Sinusoidal and Random Vibration: A Test Setup Guide for Industrial Engineers
07/21/2026 10:30:38

During the operation of industrial machinery or the transportation of goods, persistent mechanical vibrations inevitably occur; these are a primary cause of material fatigue, loosened connections, and cracking in printed circuit boards (PCBs). To ensure product integrity before delivery to customers, R&D and QA/QC engineers must simulate these dynamic forces using vibration test systems.

Capacities of laboratory centrifuge tubes
07/20/2026 13:55:40

Tubes with capacities of 0.2 ml, 1.5 ml, 15 ml, or 50 ml are commonly found in laboratories, yet each type is associated with specific sample categories and equipment configurations. DNA and RNA samples typically require small-volume microtubes; blood and cell samples often utilize 5 ml or 15 ml tubes; while large-volume processing workflows may require tubes of 50 ml, 100 ml, or greater capacity

How Much Does Atmospheric Pressure Need to Drop Before It Rains ?
07/20/2026 10:11:04

A barometric pressure meter (barometer) often detects changes in weather conditions before rainfall begins. As atmospheric pressure falls, the structure of the surrounding air mass is also changing. However, there is no fixed pressure threshold that guarantees rain will occur.

Stay Updated with Offers

Get exclusive volume discounts, bulk pricing updates, and new product alerts delivered directly to your inbox.

By subscribing, you agree to our Terms of Service and Privacy Policy.

Quick Support

Direct access to our certified experts